This is my old note related to VS 2005, so it might work out of the box in newer versions of Visual Studio. I haven’t checked, but I still believe this information could be helpful to someone, so it’s a pleasure to share it.
The first time I encountered this error in my error handling mechanism (Nbug), I was surprised at how to retrieve the line number in the source code for the exception in WinDbg. Take a look at a simple console application that throws an exception of this type.
using System;
using System.Collections.Generic;
using System.Linq;
using System.Text;
using System.Threading.Tasks;

namespace ConsoleApplication5
{
    static class testClass
    {
        // here constructor
        static  testClass()
        {
            throw new Exception("test");

        }

        static public void printInfo()
        {
            System.Diagnostics.Trace.WriteLine("test Info");
        }
    }


    class Program
    {
        static void Main(string[] args)
        {
            testClass.printInfo();


        }
    }
}
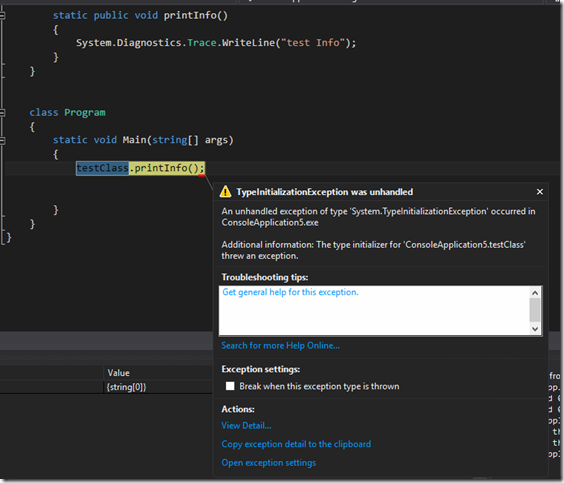
When we run the application in debug mode from Visual Studio, it crashes, and all the necessary information for debugging is displayed, as shown below
The stack trace of the inner exception points to the location in the code where the exception was thrown.
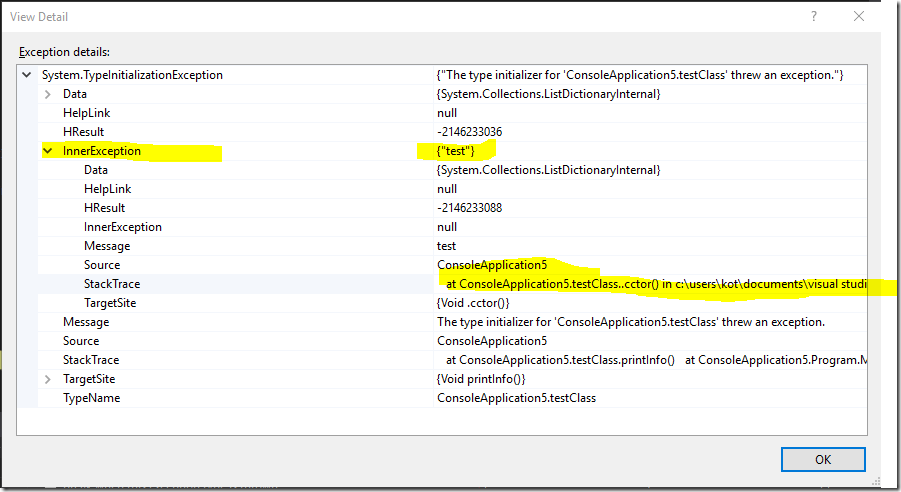
In my case, the stack trace of the inner exception is as follows:
at ConsoleApplication5.testClass..cctor() in c:\users\kot\documents\visual studio 2015\Projects\ConsoleApplication5\ConsoleApplication5\Program.cs:line 14
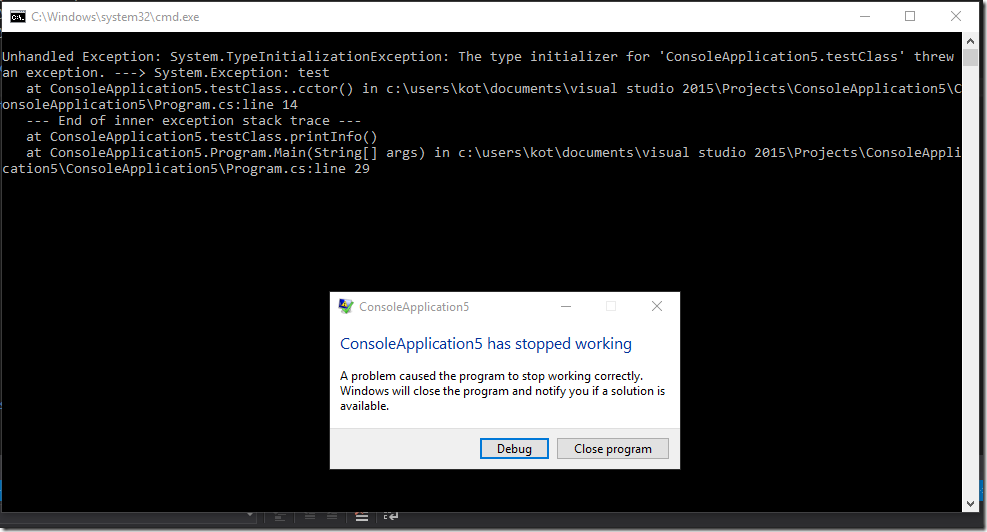
In release configuration, it also provides information about the location in the code where the error occurred, as shown below
But what should we do if we only have a memory dump of the crashed process that was collected for us? (memory dumps can be generated manually or by Windows OS, depending on its configuration).
On Windows, the WinDbg tool is a versatile instrument that has been helpful in code troubleshooting and dump analysis for decades. So, let’s imagine we don’t have detailed exception information (though, of course, your reporting mechanism should collect error logs), and we want to retrieve the inner exception details in WinDbg.
First of all, we need to ensure that the symbol information is correctly loaded (please refer to online resources for configuring it in WinDbg). Without correctly loaded symbols, your results may be inaccurate. For example, one popular BSOD analysis tool, BlueScreenView, can display incorrect information about the driver responsible for a crash in certain circumstances.
To check that symbols are loaded correctly:
0:000> !sym noisy
noisy mode - symbol prompts on
0:000> .reload /f
you should see
DBGENG:  C:\Users\kot\Documents\Visual Studio 2015\Projects\ConsoleApplication5\ConsoleApplication5\bin\Release\ConsoleApplication5.exe – Mapped image memory

DBGHELP: ConsoleApplication5 – private symbols & lines
c:\users\kot\documents\visual studio 2015\Projects\ConsoleApplication5\ConsoleApplication5\obj\Release\ConsoleApplication5.pdb
Where ConsoleApplication5.exe is our bogus application.
Open user mode dump file in Windbg (File / Open crash dump). and load sos extension (shipped with .NET framework) by command:
.loadby sos clr
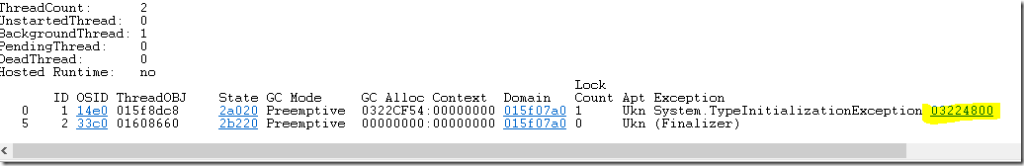
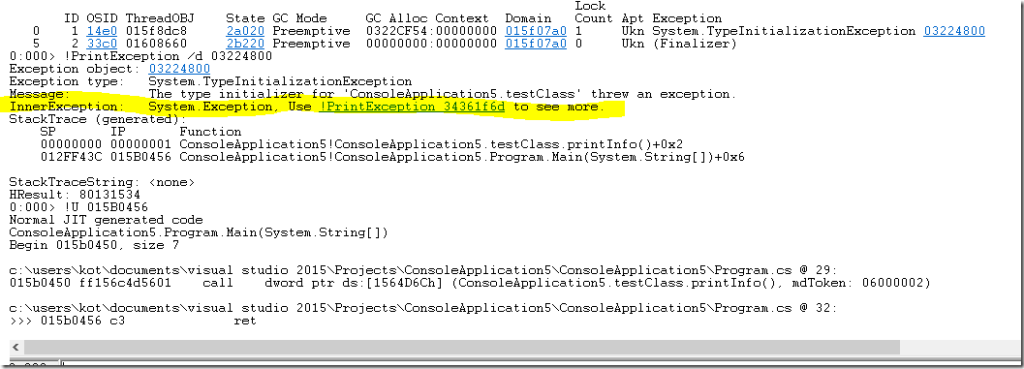
Type !threads to view the available threads in our application. You should see something like this:

Where 02fc4800 is the address of the exception, which we will examine further using the !PrintException command:
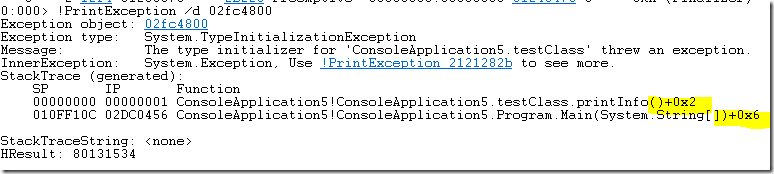
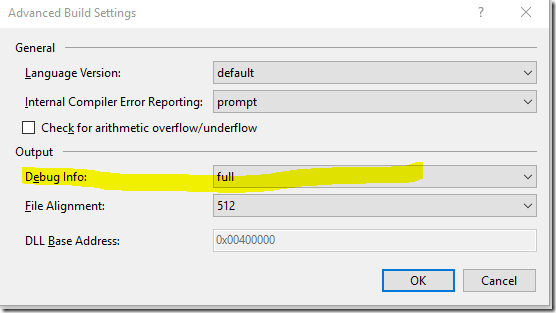
Unfortunately, the offsets 0x2 and 0x6 are not very informative regarding the lines of code where the exception occurred. This is because we need to set the ‘Debug Info’ to ‘Full’ in the Visual Studio 2015 project properties: Project Properties > Build > ‘Advanced’ > Debug Info, as shown below.
After rebuilding the solution, running our bogus application, reloading the user-mode dump, and repeating the actions described above, we still didn’t get the details. While !clrstack showed the source code lines, !PrintException didn’t.”
The workaround is described by Brian Rasmussen here – http://stackoverflow.com/questions/1553041/private-symbol-loaded-but-no-line-number-displayed.
Type the !threads command to get the address of the exception
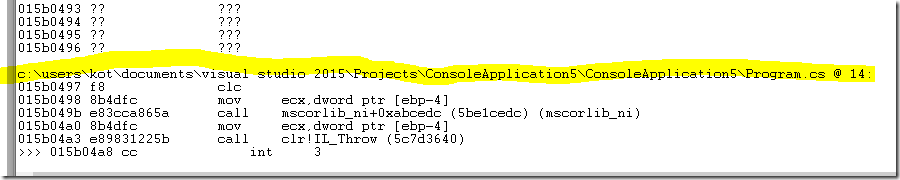
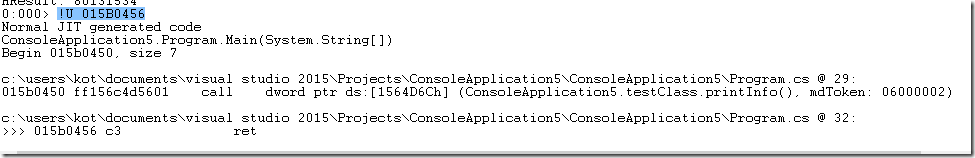
Get information about the exception using !PrintException 34361f6d. To retrieve information about the line of code, use !U with the value of the IP register from the stack trace. In my case:
!U 015B0456
Do the same with the inner exception.
!PrintException /d 03223158
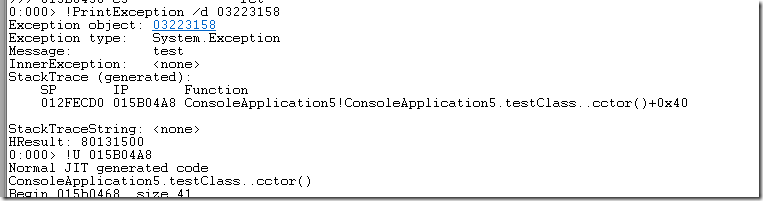
!U 015B04A8
and here it is