Latency degradation due to JVM GC
This story is about choosing the correct garbage collector and its potential impact on performance. Performance is typically divided into two main areas of interest:
- Customer-related aspects:
- Latency
- Throughput
- Financial aspects:
- Resource costs in the cloud
Of course, I mentioned these two areas as a matter of interest in this article, but you may have your own perspective.
So, what is JVM ergonomics? Basically, it refers to the functionality that allows the JVM to automatically adjust its internal configuration based on the environment, including available memory, the number of CPUs, and other factors. One aspect of this self-tuning capability is support for containerized environments, where JVMs have become increasingly popular. This includes “understanding” container-related configurations, such as memory and CPU limits.
We will discuss a few container-specific aspects. Let’s start with some practical examples and then take a closer look at the theory.
At some point, after upgrading Keycloak (part of our authentication platform) to a new version, I noticed that the p99 latency of responses had increased significantly, as shown in the Grafana dashboard below.
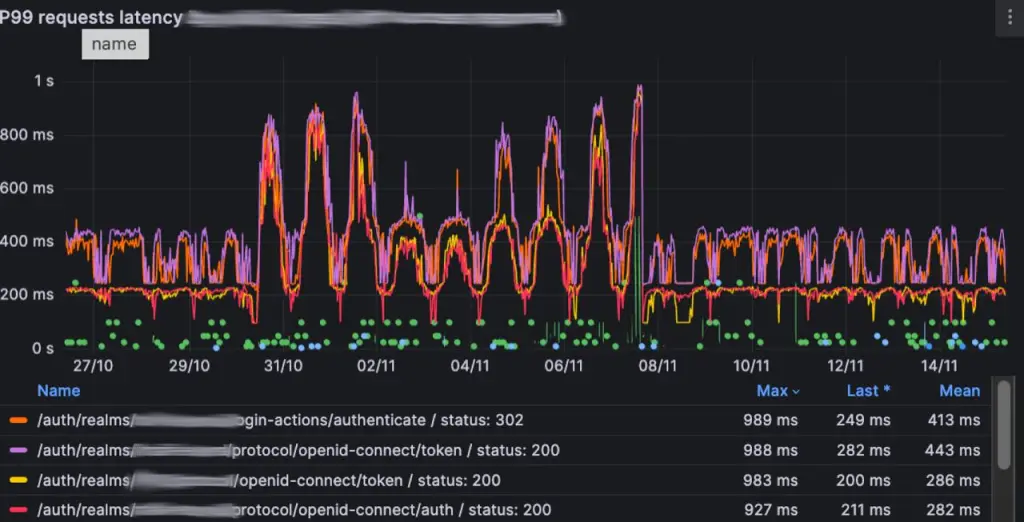
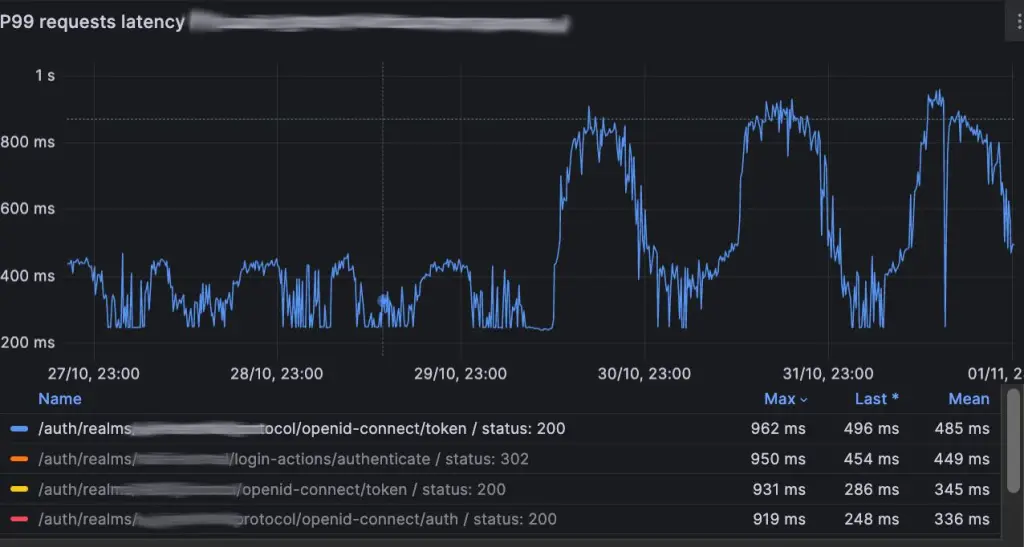
Since standard OIDC endpoints (/auth, /authenticate, and /token) started responding more slowly after the Keycloak version upgrade, this directly impacted our customers’ user experience.
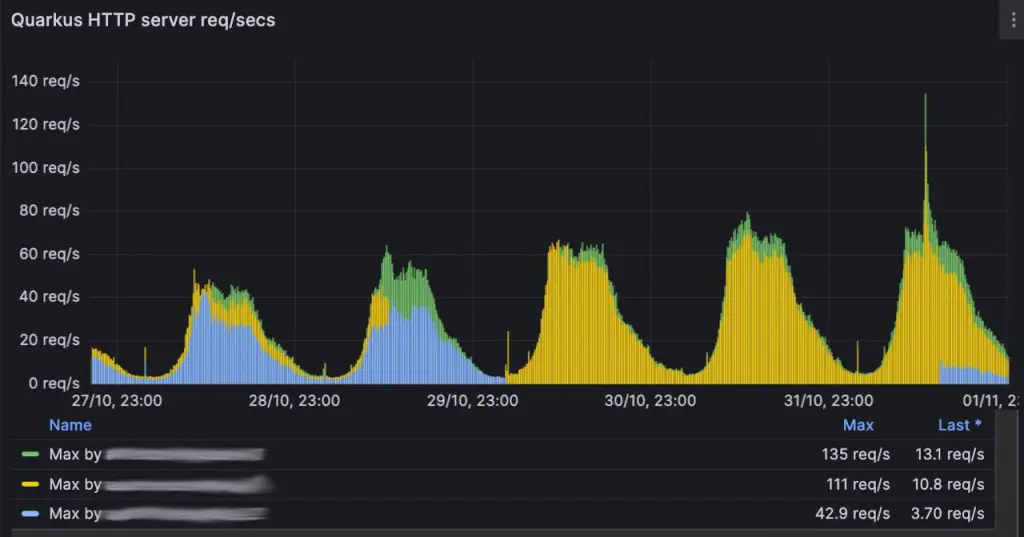
After checking other dashboards, I found that along with increased latency, CPU utilization and CPU usage by the garbage collector (GC) had also increased. See the dashboards below.
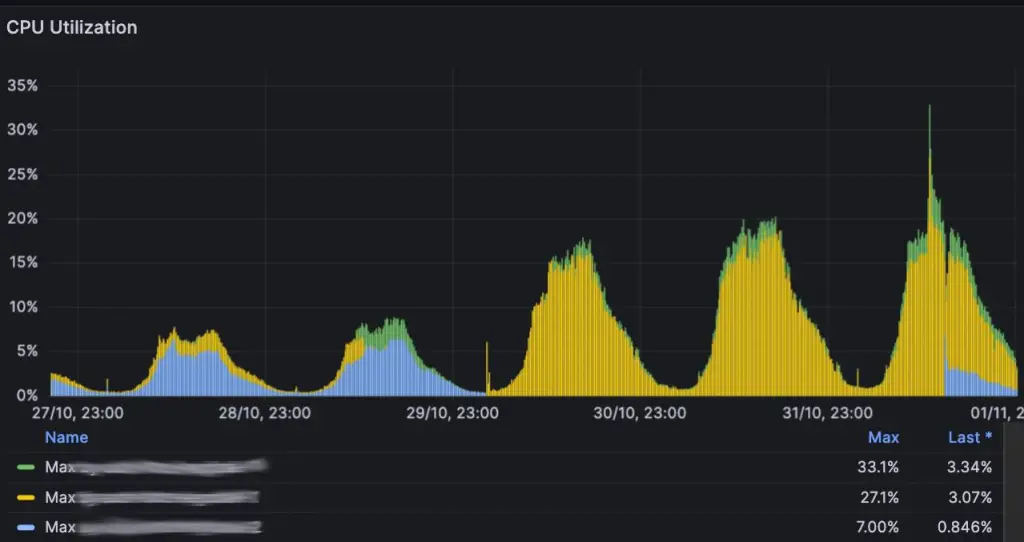
And the next metric, GC CPU usage, is a potential answer to the question of what is going on
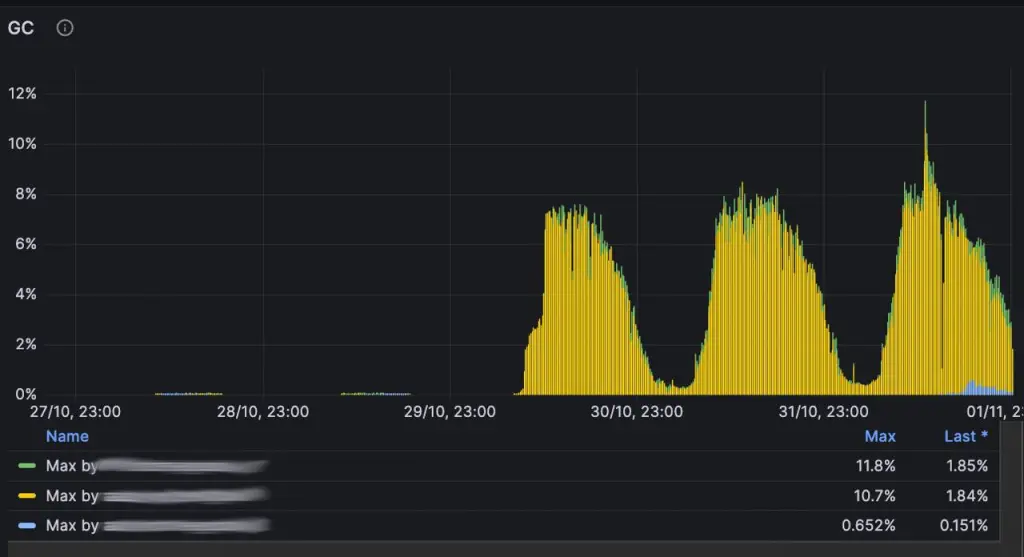
Unfortunately, I have lost the screenshot of the dashboard that showed JVM pauses due to GC activity, which occurs when the JVM cannot run your threads – especially during Stop-The-World (STW) pauses in Garbage Collection (GC) processes.
Long story short, the problem is a result of this commit
https://github.com/keycloak/keycloak/commit/2b16fda3a175b5eef66614e709838d7c7014e4b9
where XX:+UseParallelGC option enabled ParallelGC GC instead of previously used G1GC.
The Keycloak’s contributors/maintainers also noticed that performance issue https://github.com/keycloak/keycloak/issues/29033
this is why it’s strongly recommended to have performance tests in place before PROD.
The bug description is related to the Argon hashing algorithm, which is used by default for password hashing in Keycloak (with a configurable iteration count parameter, but set to more than 27,500 by default). In our case, we use passwordless authentication flows that are not related to the Argon hashing algorithm, but that didn’t change the fact that the new garbage collection (GC) behavior impacted our latency.
Anyway, the recommended option here is to reconfigure the Keycloak JVM options in your deployment according to your needs to avoid possible impacts related to changes made by the maintainers.
JVM ergonomic aspects
How is this related to JVM ergonomics? Well, JVM ergonomics can automatically select a GC based on CPU and memory configuration instead of requiring you to do it manually. This means that understanding JVM ergonomics can help you optimize performance more effectively.
Another important aspect is cost optimization, as performance and cost are always closely linked.
Let’s experiment with some JVM configuration options to see JVM ergonomics in action. I have prepared a GitHub repository (https://github.com/TorinKS/jvm-experiments/tree/main) that we can use for our experiments.
Our simple Java application is the following
package xyz.recallfor.jvm.ergonomics;

import java.lang.management.ManagementFactory;
import com.sun.management.OperatingSystemMXBean;
import java.text.NumberFormat;

public class App
{
    public static void main( String[] args )
    {
        Runtime runtime = Runtime.getRuntime();
        OperatingSystemMXBean osBean = (OperatingSystemMXBean) ManagementFactory.getOperatingSystemMXBean();
        NumberFormat formatter = NumberFormat.getInstance();

        int availableProcessors = runtime.availableProcessors();
        long totalMemoryMb = runtime.totalMemory() / 1_048_576;
        long maxMemoryMb = runtime.maxMemory() / 1_048_576;
        long freeMemoryMb = runtime.freeMemory() / 1_048_576;
        long totalPhysicalMemoryMb = osBean.getTotalPhysicalMemorySize() / 1_048_576;

        System.out.println("Available processors: " + availableProcessors);
        System.out.println("Total physical RAM: " + formatter.format(totalPhysicalMemoryMb) + " MB");
        System.out.println("JVM total memory: " + formatter.format(totalMemoryMb) + " MB");
        System.out.println("JVM max memory: " + formatter.format(maxMemoryMb) + " MB");
        System.out.println("JVM free memory: " + formatter.format(freeMemoryMb) + " MB");
    }
}
We will run this app inside and outside the container with different parameters to observe how JVM ergonomics work.
To start playing with it, just clone the project
git clone https://github.com/TorinKS/jvm-experiments.git
cd jvm-ergonomics
If we run Java application locally :
/Users/kot/Library/Java/JavaVirtualMachines/corretto-17.0.11/Contents/Home/bin/java -Dfile.encoding=UTF-8 -classpath /Users/kot/source/jvm/jvm-ergonomics/target/classes xyz.recallfor.jvm.ergonomics.App
Available processors: 12
Total physical RAM: 16,384 MB
JVM total memory: 260 MB
JVM max memory: 4,096 MB
JVM free memory: 256 MB
As you can see, the JVM detects 12 processors on the MacBook M2 Pro because it has 12 cores on board.
Checkout to the branch with Docker resource constraints and execute build-run.sh
git checkout jvm17-without-docker-params
./build-run.sh
Now the execution result (which also includes ergonomics parameter) is shown below
View a summary of image vulnerabilities and recommendations → docker scout quickview
intx CICompilerCount = 4 {product} {ergonomic}
uint ConcGCThreads = 3 {product} {ergonomic}
uint G1ConcRefinementThreads = 10 {product} {ergonomic}
size_t G1HeapRegionSize = 1048576 {product} {ergonomic}
uintx GCDrainStackTargetSize = 64 {product} {ergonomic}
size_t InitialHeapSize = 130023424 {product} {ergonomic}
size_t MarkStackSize = 4194304 {product} {ergonomic}
size_t MaxHeapSize = 2055208960 {product} {ergonomic}
size_t MaxNewSize = 1233125376 {product} {ergonomic}
size_t MinHeapDeltaBytes = 1048576 {product} {ergonomic}
size_t MinHeapSize = 8388608 {product} {ergonomic}
uintx NonNMethodCodeHeapSize = 5839564 {pd product} {ergonomic}
uintx NonProfiledCodeHeapSize = 122909338 {pd product} {ergonomic}
uintx ProfiledCodeHeapSize = 122909338 {pd product} {ergonomic}
uintx ReservedCodeCacheSize = 251658240 {pd product} {ergonomic}
bool SegmentedCodeCache = true {product} {ergonomic}
size_t SoftMaxHeapSize = 2055208960 {manageable} {ergonomic}
bool UseCompressedClassPointers = true {product lp64_product} {ergonomic}
bool UseCompressedOops = true {product lp64_product} {ergonomic}
bool UseG1GC = true {product} {ergonomic}
App: available processors: 12
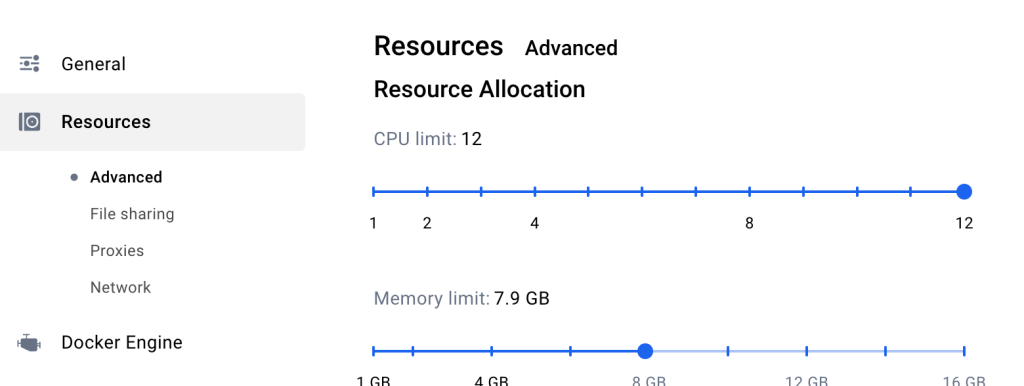
App: total physical RAM: 7,836 MB
App: JVM total memory: 126 MB
App: max memory: 1,960 MB
App: free memory: 123 MB
Just note that we are using the azul/zulu-openjdk-alpine:17-latest image with a JVM version that respects containerization parameters, and we have::
- size_t MaxHeapSize = 2055208960 {product}
bool UseG1GC = true- App: total physical RAM: 7,836 MB
The total physical RAM is limited by the Docker configuration (Settings / Resources / Advanced).
or
docker info | grep -i "memory"
WARNING: daemon is not using the default seccomp profile
 Total Memory: 7.653GiB
Checkout to ‘docker-with-constraints’ branch and run ./build-run.sh ,the result is below
 size_t MaxHeapSize                              = 1256194048
bool UseG1GC                                  = true
App: available processors: 4
App: total physical RAM: 4,792 MB
JVM 17 respects Docker constraints, so it recognizes the memory specified in docker --memory=4792MB, and the maximum heap size is set to approximately 1.17 GB
By default, JVM ergonomics configuration allows the JVM to allocate 1/4 of the available memory for the heap inside a container and 1/64 of the memory outside containers. This is why we see 1/4 of the memory allocated by default inside containers. Often, this default option is not optimal and needs to be overridden with:
- -XX:MaxRAMPercentage
- -Xmx
-Xmx parameter is not recommended, as it requires configuration in two places:
- Container memory limits (in Kubernetes or Docker memory constraints)
- JVM configuration
In contrast, -XX:MaxRAMPercentage is a better option. This parameter allows the JVM to automatically adjust the heap size based on available memory. For example, if the Kubernetes memory limit is set to 4 GB, the JVM will allocate 4GB * MaxRAMPercentage for the heap. Setting this parameter to 75 is a good starting point. Keycloak’s kc.sh for 26.1.4 has the following configuration for Keycloak in containers
-XX:MaxRAMPercentage=70 -XX:MinRAMPercentage=70 -XX:InitialRAMPercentage=50
Another interesting aspect is how the JVM ergonomics choose a garbage collector (GC) when CPU resources are limited. So, check out and execute build-run.sh.
git checkout selecting-0.5-cpu
./build-run.sh
and now the output is
     bool UseSerialGC                              = true                                      {product} {ergonomic}
App: available processors: 1
As you can see, the default GC is SerialGC, and the JVM detects only one available processor. Now, let’s analyze the next optimization we can apply here.
Optimization of available processors
This optimization is possible due to how container constraints (such as Kubernetes limits or Docker constraints) work internally.
For the OS kernel scheduler, container constraints apply in a way that you might not expect, but this is a broader topic that I hope to cover later.
Internally, the JVM configures parameters such as the number of threads in thread pools based on the number of active processors. A good starting point for optimization is setting the following parameter:
–XX:ActiveProcessorCount=2
for cases where k8s/container CPU limit is lower than 1000m
for k8s CPU limits lower than 1000m for containers start your optimization from setting up:
–XX:ActiveProcessorCount=2
we can see in the benchmark tests how this benefits both performance and FinOps, as good performance with low resource usage helps reduce costs.
Let’s run the final experiment:
git checkout old-jvm-without-ergonomic-support
./build-run.sh
Here, we have a Dockerfile with an old JDK version (openjdk:8u102-jre) that doesn’t support ergonomics, so the
docker run --rm --memory=4792MB --cpus="2.0" jvm-ergonomics | grep -Ei "App\:|ergonomic"
output will be
App: available processors: 12
App: total physical RAM: 7,836 MB
App: JVM total memory: 119 MB
App: max memory: 1,742 MB
App: free memory: 118 MB
and that old JVM doesn’t respect container constraints.
That is all for this article, take a look at the perfect Microsoft video with this topic – https://www.youtube.com/watch?v=4QqsE8DBfgg
and their PowerPoint presentation – https://www.jfokus.se/jfokus22-preso/The-Diabolical-Developers-Guide-to-JVM-Ergonomics-in-Containers.pdf
It is especially interesting that using larger instances of VM with proper JVM configuration benefits in saving:
- 9 vCPUs on standby
- 72 GB of RAM on standby
compared to the instances with a smaller number of CPU and amount of RAM.
The final idea is that you should take into account 3 aspects
- your SLA/SLO/SLI
- JVM configuration and performance tests
- finops (the instance size ,etc)